A matrix question is a study activity that groups together all the relevant questions on a particular topic in a row-column format. This simplified activity allows your study participants to view and answer survey questions in a single glance. Very often, matrix-style answer choices are offered on a scale.
What is the Benefit of a Matrix Style Question?
There are many benefits to adding matrix questions to your UX study:
- Space Saving: The matrix survey is displayed using row-column format, thereby avoiding long pages of questions and answers. A good quantity of 4-5 questions with their answers are easily accommodated on a single page. Your study participant feels comfortable and less intimidated when they see only one question.
- Reduced Survey Response Time: Matrix survey questions follow a definite pattern with the same response options for every question. Hence, it is easy for your study participants to program their minds to answer the questions. On the other hand, there are different options for each question in a typical survey questionnaire, which can sometimes confuse your target audience.
- Increased Survey Responses: With a clear single-page layout and easy to comprehend answer options, your participants will be keen to take the survey, thereby increasing the survey response rates.
- Eliminates Monotony: Attending back-to-back survey questions can get monotonous if it consists of multiple long and short answers type questions. Each of these questions requires an in-depth thinking process. But, matrix question and answer eliminate monotony by grouping together the questions based on the same topic under one head. Your study participants just need to focus on the product as a whole by selecting similar answer options.
- Provides Insight on Multiple Sub Topics: Regular surveys try to cover a topic on the general level, but don’t always provide enough info for you to form a clear understanding of your audience’s needs. Matrix questions are an excellent way to know about your target audience’s in-depth views on various sub topics. With matrix questions, you can take a particular aspect of your product/service and frame 4-5 matrix questions around it, providing you with a more complete picture of your participants’ feelings.
How Do I Add Matrix Questions to my Study?
Add a matrix study activity to your study by following these steps:
- Login to your Userlytics client dashboard. Then, either create a new study or open the existing draft study you want to add a matrix question to.
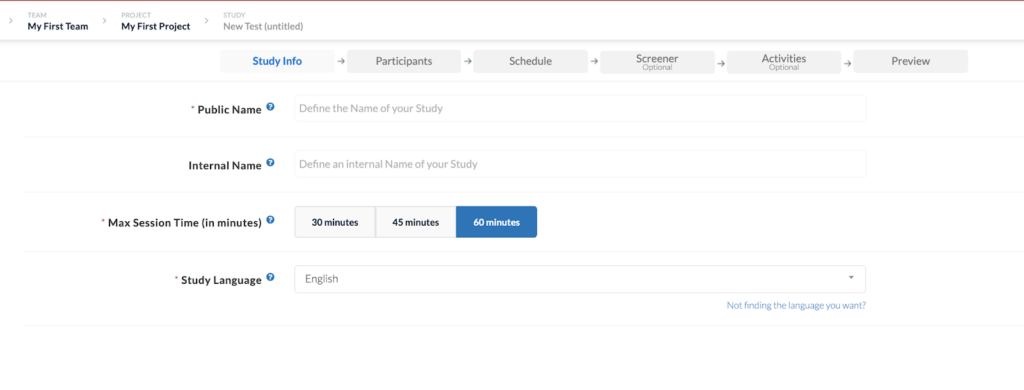
- Once in the study builder, navigate to the “activities” tab.
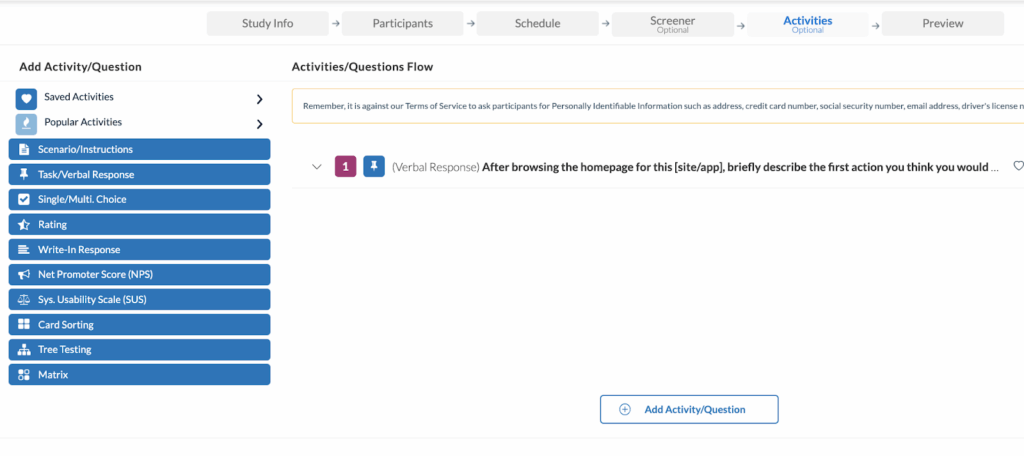
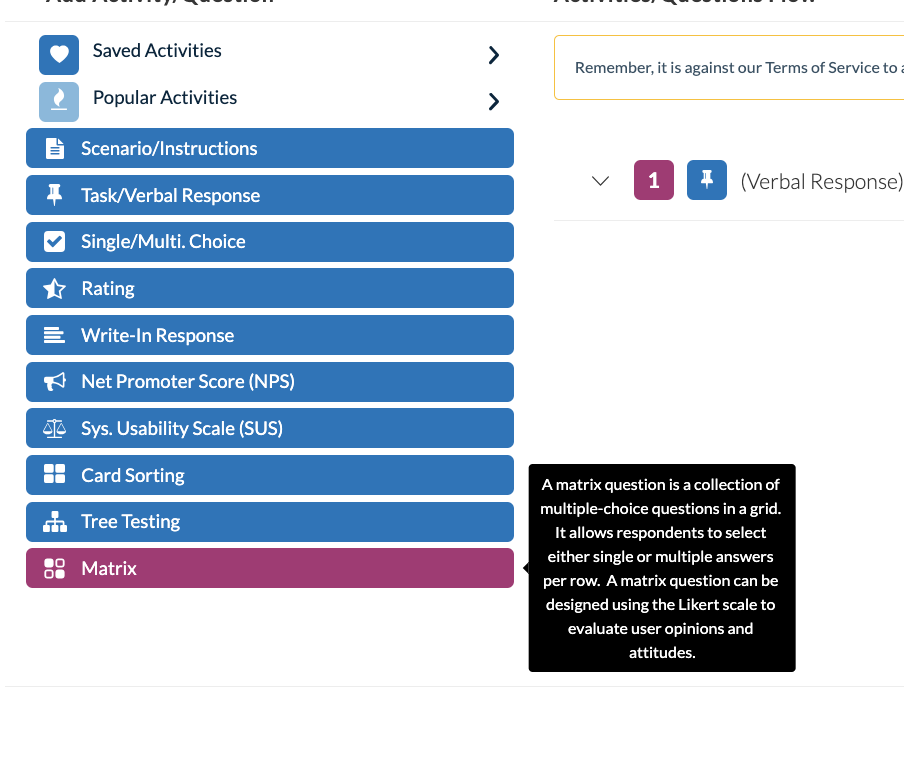
3. Click on “Matrix” within the activities menu on the left hand side.
4. Select “Add” to get started with a sample matrix question template.
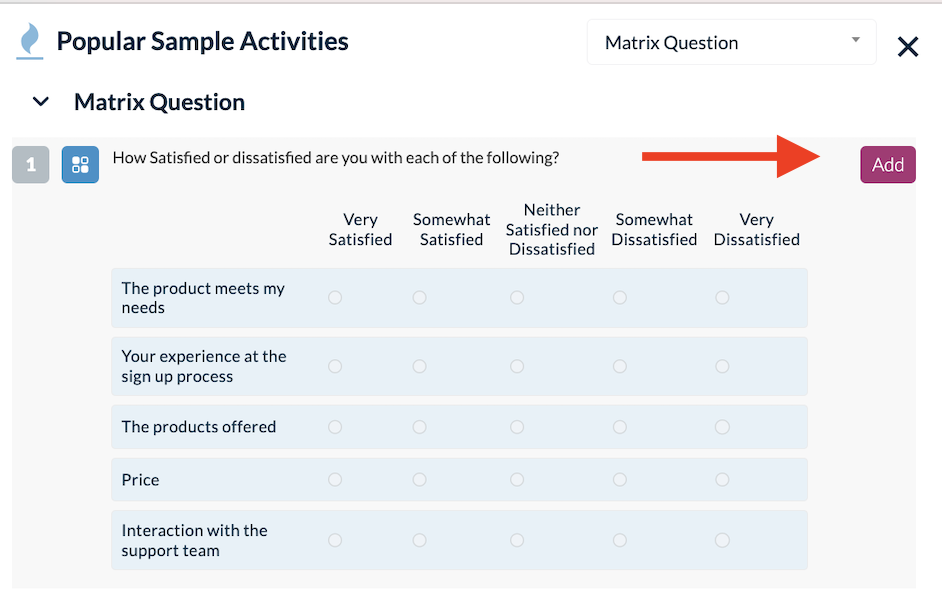
- Once added, you can edit the matrix question and answer options.
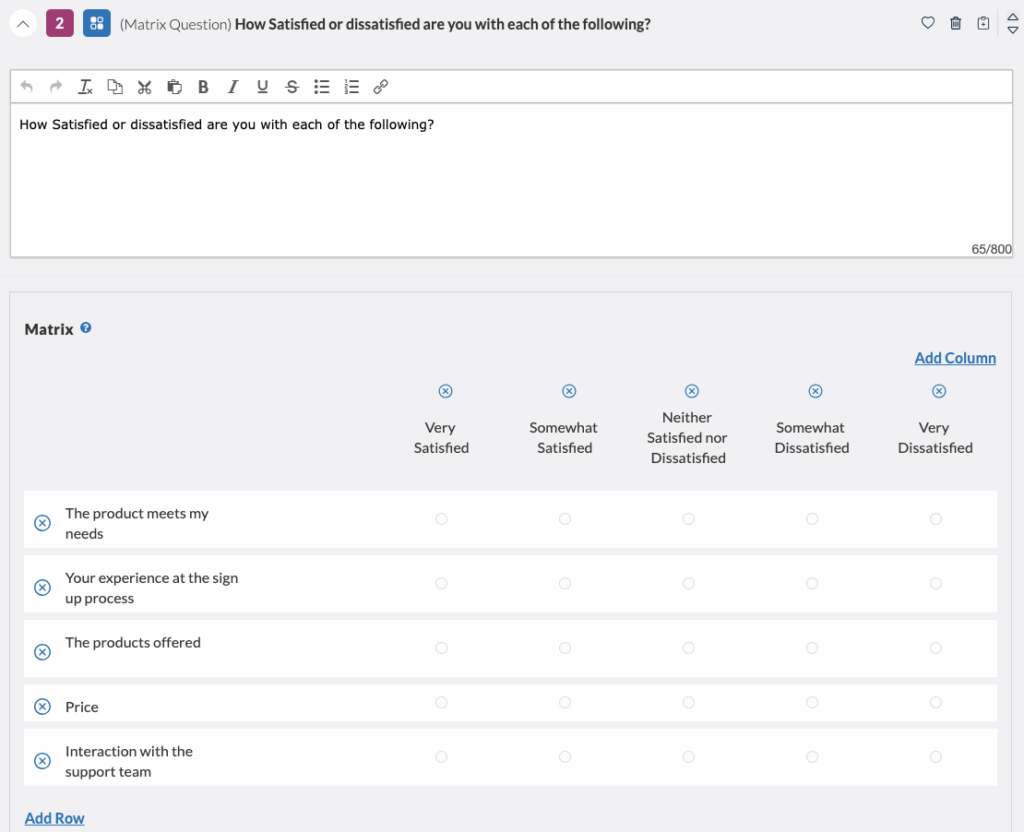
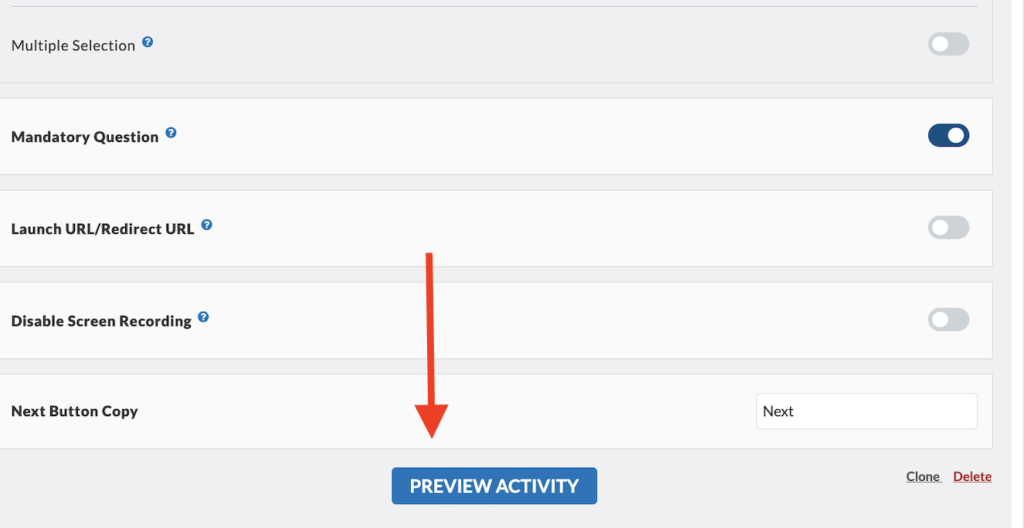
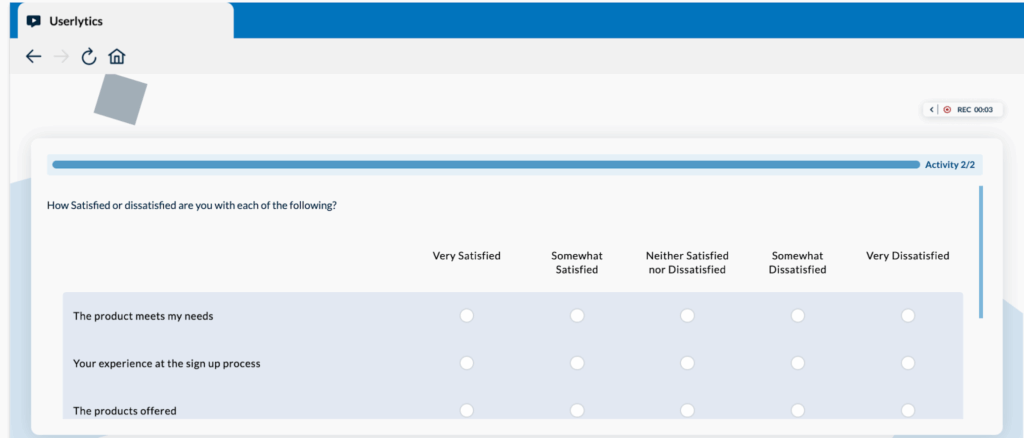
- Once you are done editing, you can click on the “Preview Activity” button to see what the matrix question will look like for your study participants.
Once you finish completing all the other elements of designing your study, you can launch your study, and begin gathering user insights from your matrix question(s)!
How Do I Analyze the Results of my Matrix Questions
You can analyze the results of your matrix question within the “Metrics” of your completed study.
The Matrix activity measures user satisfaction across multiple dimensions, allowing you to evaluate several aspects (such as product features, pricing, experience, or support) simultaneously using a consistent rating scale.
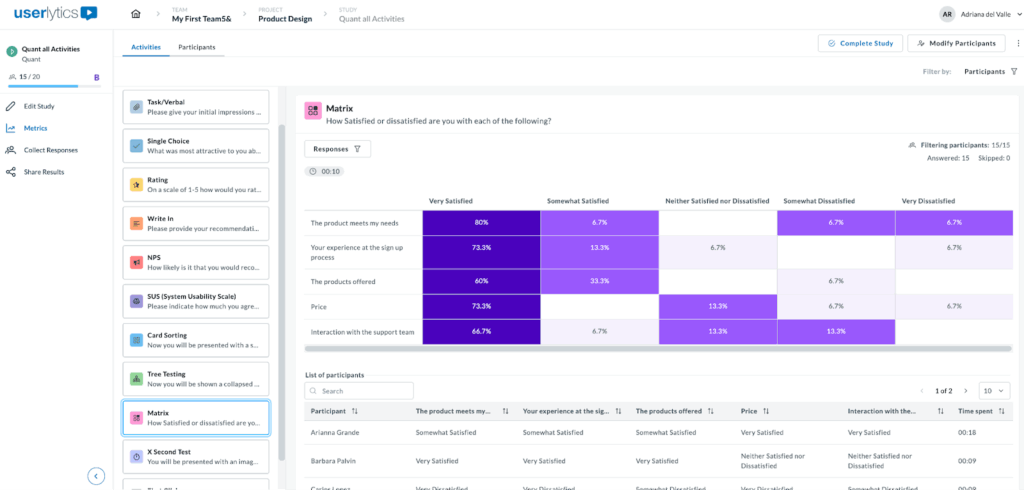
Once there, you’ll see that the color-coded matrix shows response distribution across a 5-point satisfaction scale. Darker or highlighted areas indicate features that participants find most valuable, offering insights into areas of high engagement. Variations in response patterns across rows reveal differences in user preferences, helping you identify opportunities for improvement or customization.

Below the matrix, a sortable table displays each participant’s ratings for all questions and completion time. This allows you to dive into individual responses and understand the reasoning behind specific ratings.
To download responses, locate the three-dot menu on the left side of the screen and you’ll see the option to download as a CVS file.