With Userlytics’ Tree Testing capability, you can improve the information architecture of your websites, apps and digital prototypes. Also known as reverse card sorting or card-based classification, tree testing is an excellent way to evaluate the findability of topics within your digital asset.
What is Tree Testing?
The tree testing task consists of asking the participants to use a hierarchical “map” or “tree” to find a product or theme on a website, mobile app or prototype. This allows you to analyze whether or not the informational structure of your digital asset is intuitive and clear, and if it needs improvement. Card Sorting would logically take place before a tree test; In fact, Tree Testing is a good way to validate the results from your Card Sorting exercises.
How Do I Create a Tree Testing Task in my User Experience Test?
To create a Tree Testing task within your user experience test, go to your Userlytics dashboard. Click on “Create New Test” if you are building out a new test.

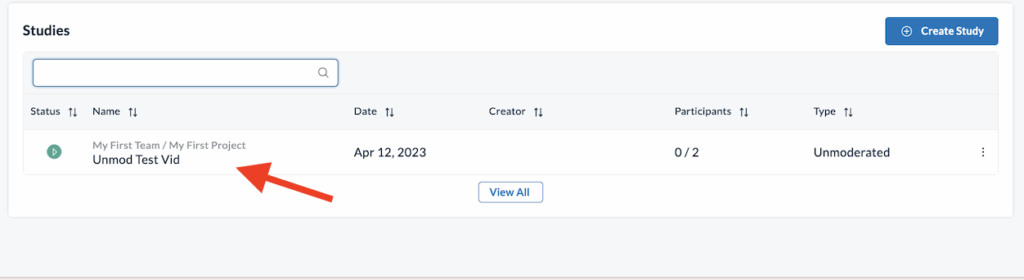
Or, if you are adding a task to a user experience test you have already begun building out, click on the study from your dashboard that you would like to add the Tree Testing task to.
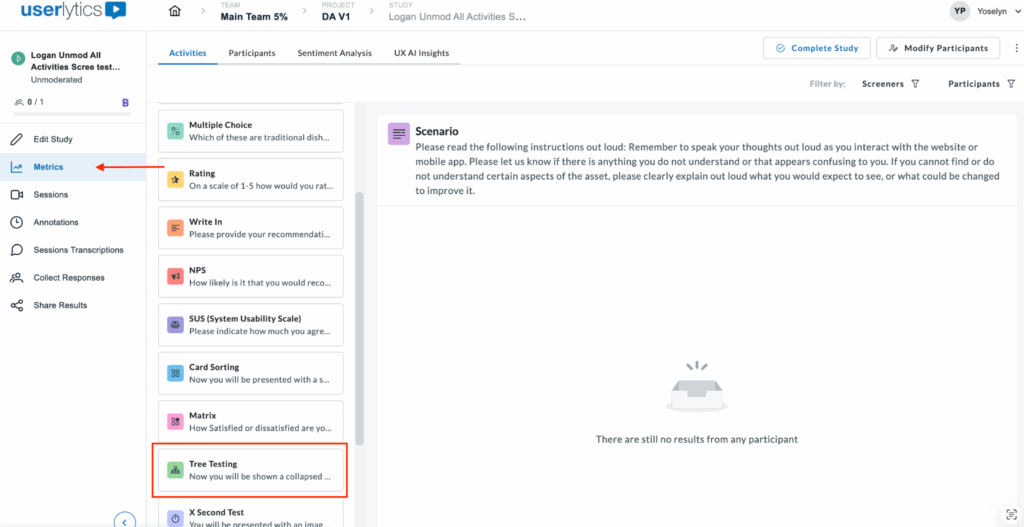
Once you have entered the test builder, select the Activities Tab, and then click “Tree Testing” on the left-hand side of the screen where the test tasks and questions appear.
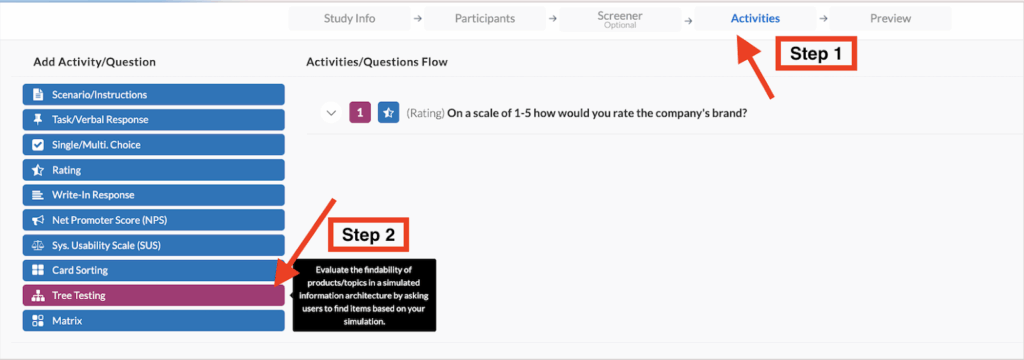
After selecting “Tree Testing” from the task choices, click on the task from within the various tasks and questions on your UX test to begin building it out.
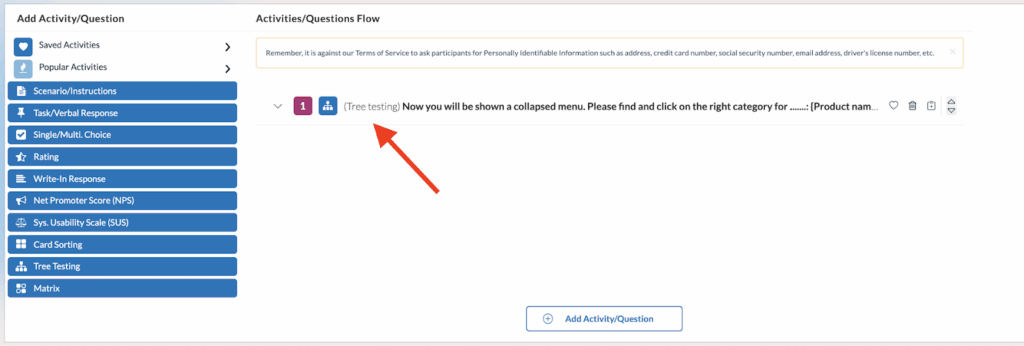
When building out your Tree Testing task, first, you will have to customize the text your testers will see. Here, you will define the product or theme your participants will be sorting into a specific category. Then, you will define your categories, or menu hierarchy. Here, you have the option of defining subcategories to get more and more specific. Your participants will be able to sort through these categories and choose where they believe the product you have specified fits best.
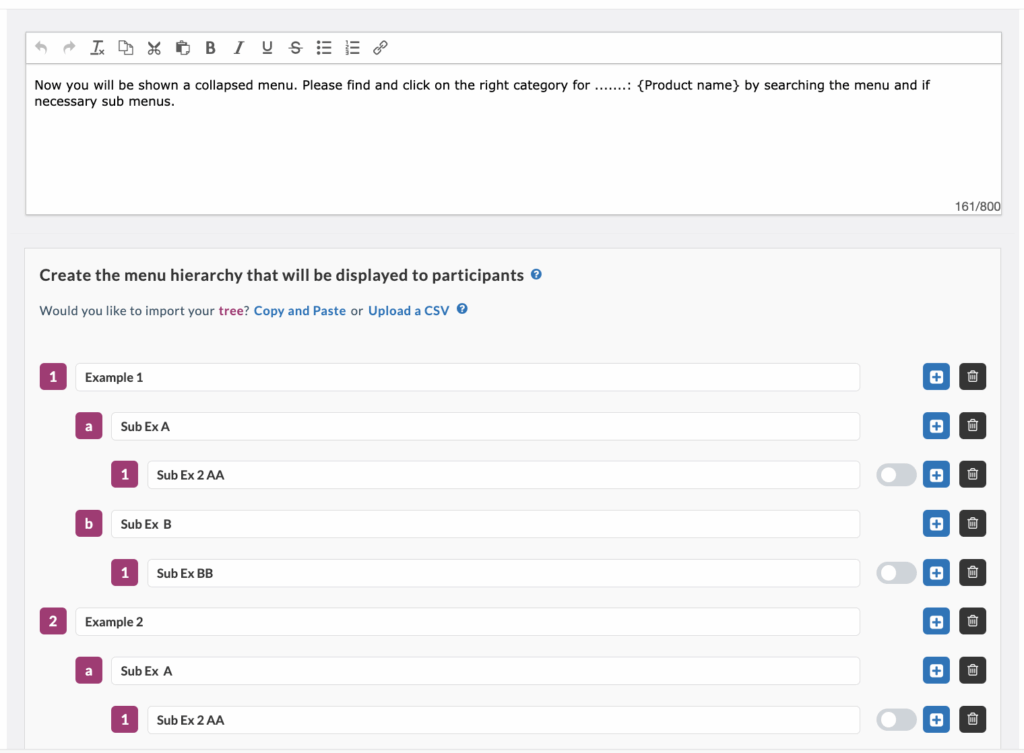
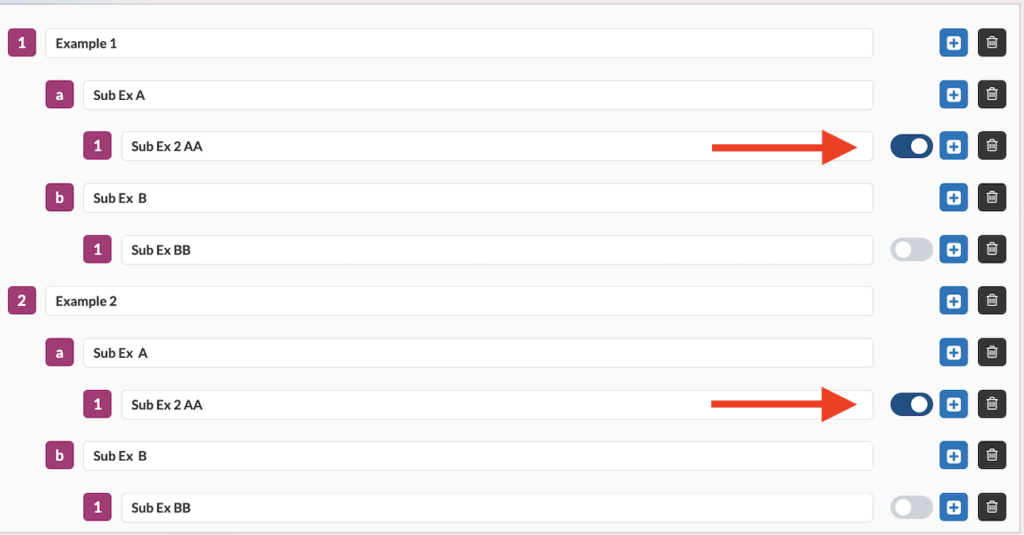
After naming your categories, click the toggle bar on the right-hand side to select the correct response to the task. This will allow you to view the success rate of your Tree Testing task after your participants complete the usability test.
How Do I Interpret Metrics from my Tree Testing Task?
After your participants have completed your user experience test, you can go into your dashboard and view and interpret the results of their Tree Testing task. First, find the “Metrics” option on your Userlytics dashboard. Then, click on the Tree Testing task within your test to view detailed metrics from your participants’ results.
Once there, you can access different views of your data, including:
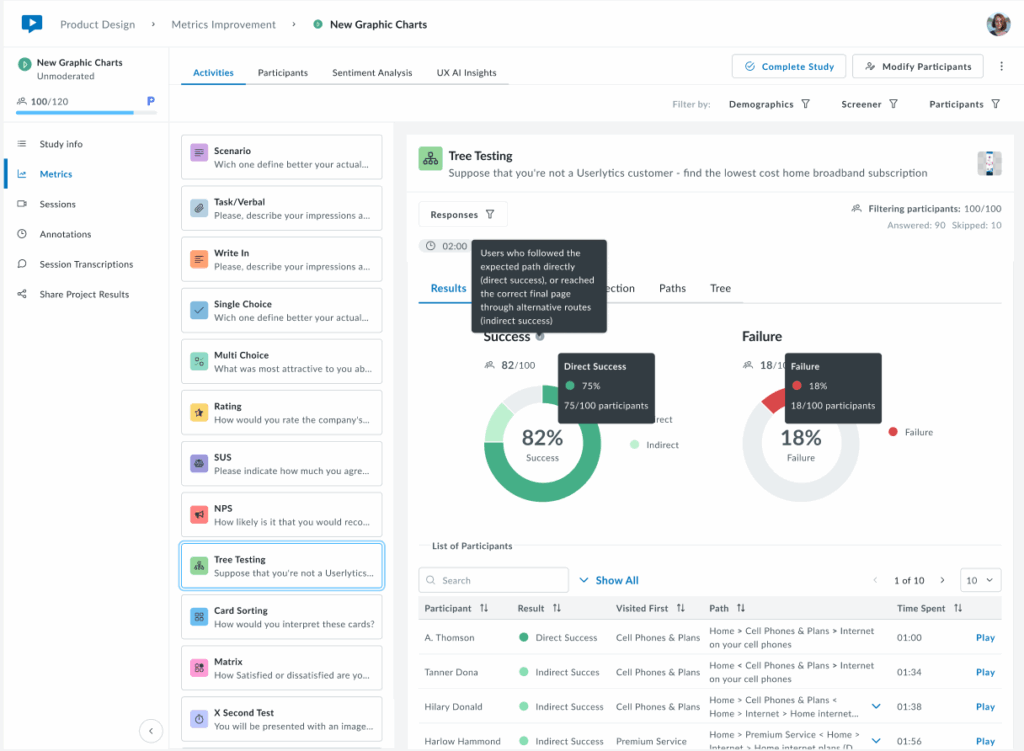
- Results: Success/failure rates and overall performance
The Results tab provides a high-level overview of task completion performance through two interactive donut charts. The Success chart displays the overall success rate as a percentage in the center, with the participant count shown below (e.g., 82/100).
The chart is divided into Direct Success (dark green) for users who followed the expected path immediately, and Indirect Success (light green) for users who reached the correct answer through alternative routes.
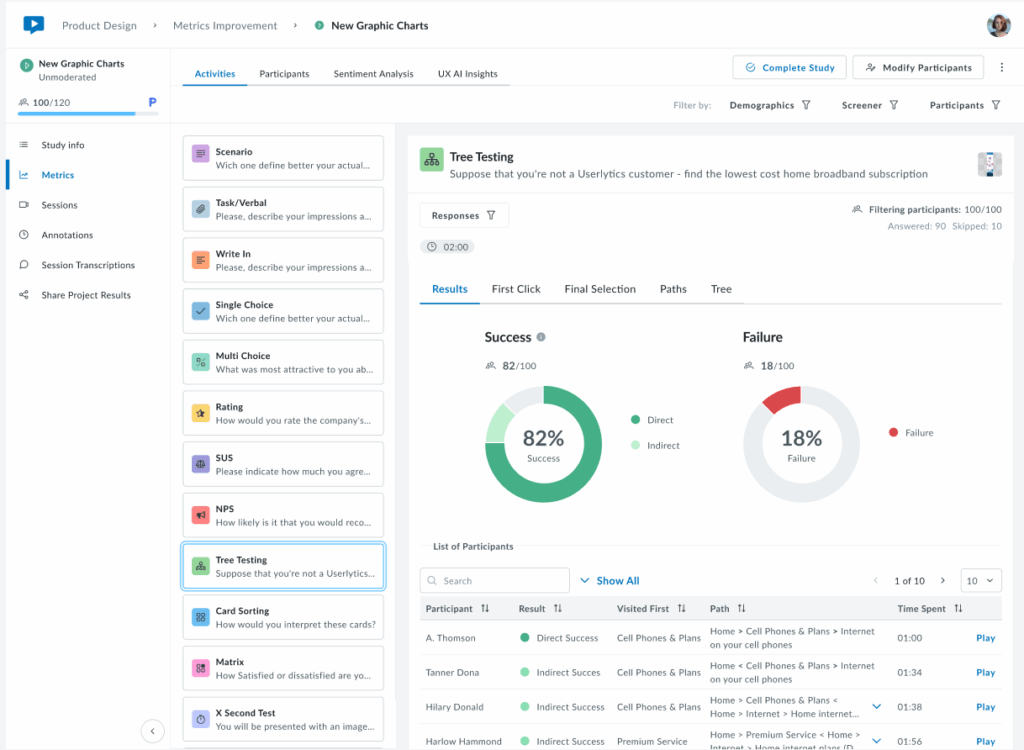
Hover over each segment to view the exact percentage and participant count. The Failure chart (right) shows the overall failure rate as a percentage, with the total number of failed attempts. Below the charts, a sortable table displays individual participant results, including their outcome (Direct Success, Indirect Success, or Failure), first click, navigation path, completion time, and video playback option. Use the Responses filter as needed.
- First Click: Analysis of users’ initial navigation choices
The First Click tab shows where participants clicked first when starting the task, helping identify which labels are more intuitive or misleading.
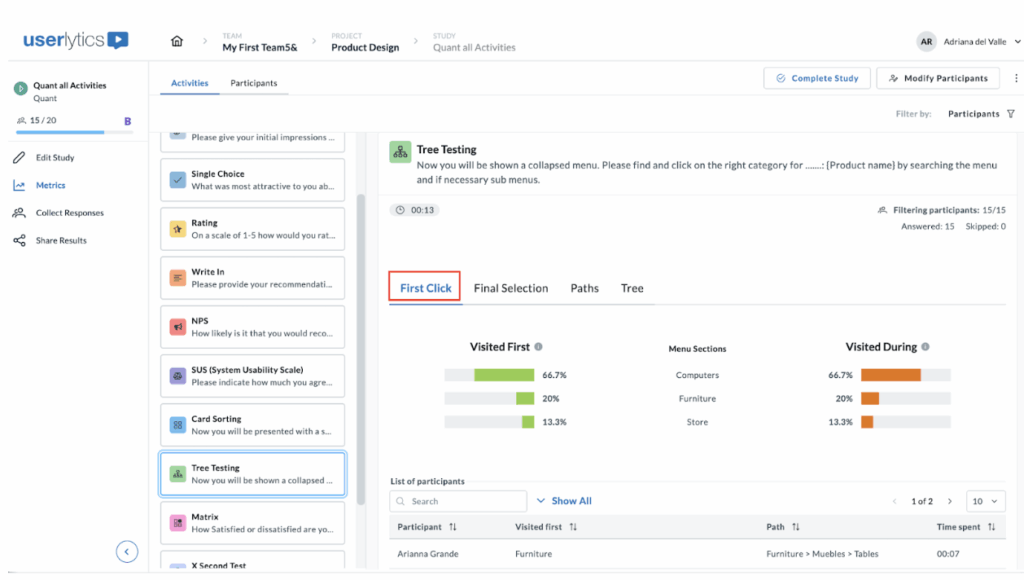
The “Visited first” and “Visited during” metrics help you understand user navigation behaviors through the hierarchical structure you’ve set up.
Here’s how these percentages are calculated, assuming a panel of 100 participants.
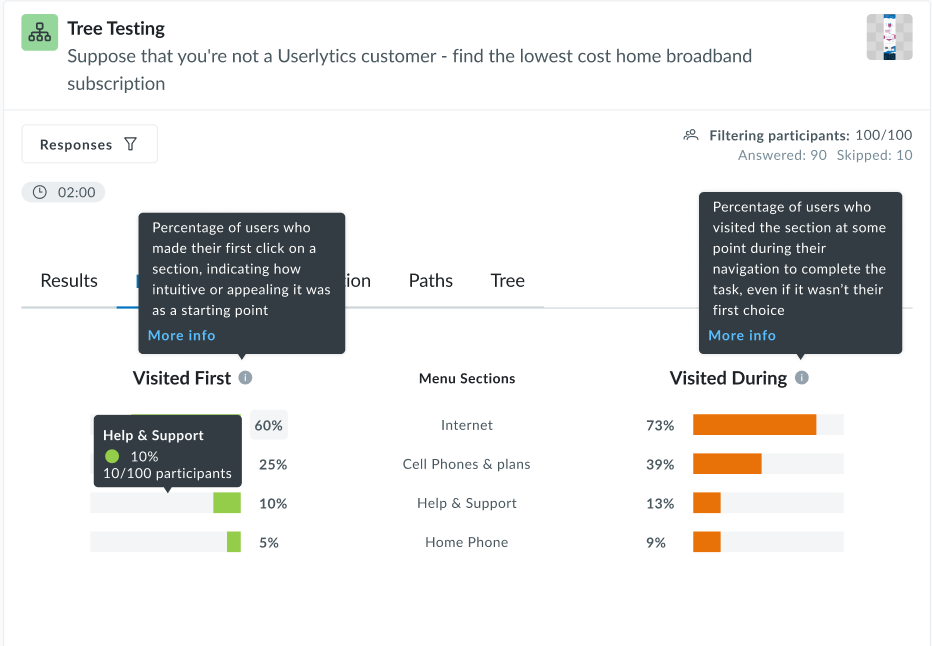
Visited First
This metric indicates how many participants first clicked on a particular node when attempting to complete a task.
Formula:

Example:

If 25 out of 100 participants clicked on the node “Help Center” as their first action, then:
Visited During
This metric reflects how many participants clicked on a particular node at any point during their navigation path, not necessarily the first or final click.
Formula:

Example:
If 60 out of 100 participants visited the “Pricing” node at any time while trying to complete the task:

Additional information:
- These metrics are calculated per activity, so for multi-task tree tests, you’ll get different percentages for each task.
- They help identify misleading labels, confusing hierarchy, or well-performing paths.
- If participants drop out or skip the task, they’re generally excluded from the denominator.
- Final Selection: Where users ended their journey
The Final Selection tab shows which menu items participants chose as their final answer. The legend on the right identifies each menu item by color, making it easy to see where participants ended their navigation journey. Below the chart, a table lists each participant’s first click, complete path taken, and time spent.
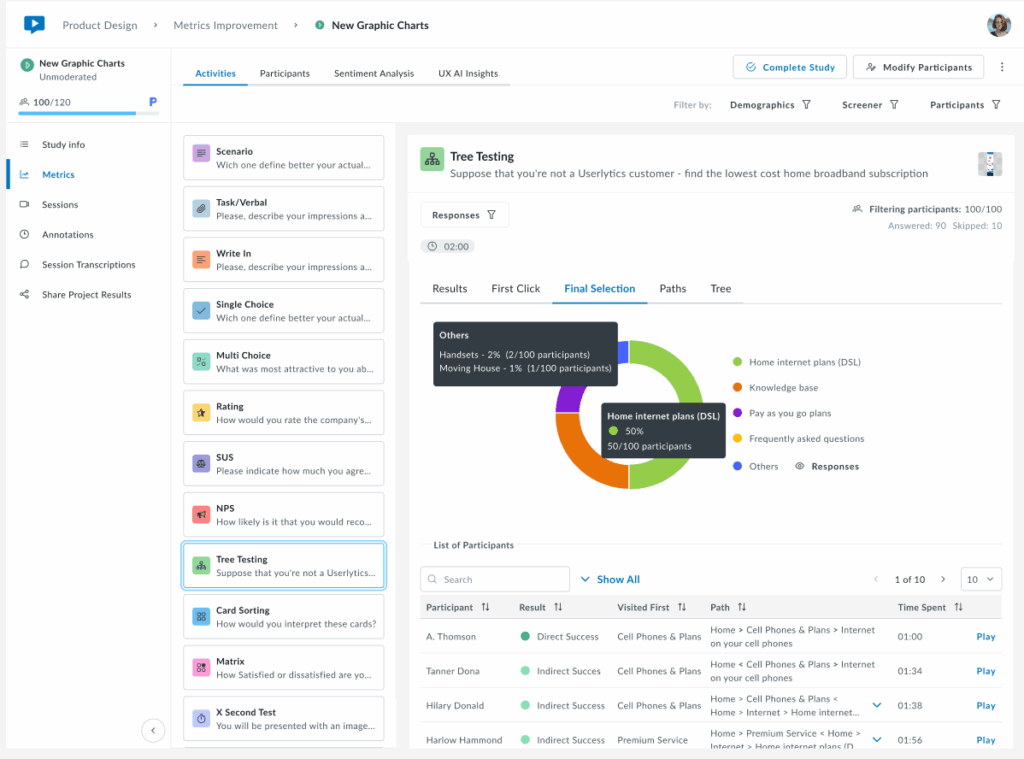
This view helps identify whether users are selecting the correct destination or ending up in wrong locations, revealing potential issues with menu structure or labeling. You may filter by participant(s) to isolate specific results.
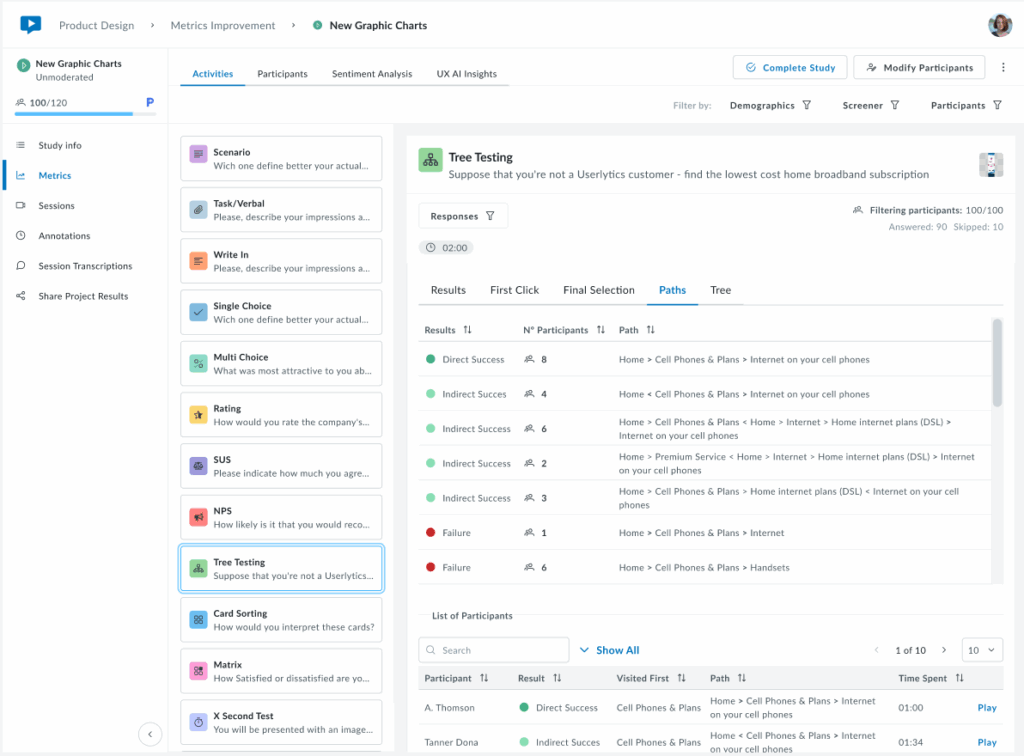
- Paths: Complete navigation routes taken
The Paths tab displays a summary of all unique navigation routes taken by participants, showing how many users followed each specific path through the menu structure.
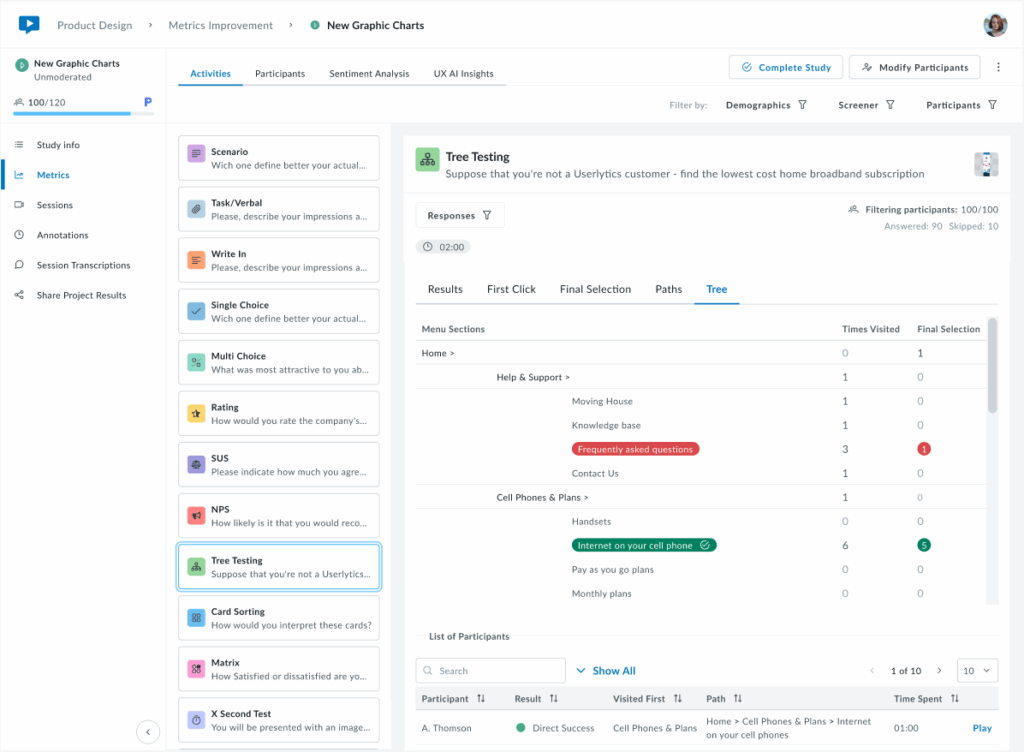
- Tree: Visual representation of the menu structure
The Tree tab displays the complete menu hierarchy, showing how many times each section and subsection was clicked during navigation and how many participants selected each item as their final answer.