With Userlytics’ Card Sorting capability, you can ensure the information architecture of your digital asset is clear, intuitive, and leads your customers to where they’re trying to go. With a more direct website layout, you can increase your conversions, retain customers, and boost business.
What is Card Sorting?
Card Sorting is a popular tool for exploring the “Mental Model” of your study participants as they search for information, products or solutions on your digital asset. The information you gain from your Card Sorting activity metrics will allow you to optimize the Information Architecture (IA) of your websites, mobile apps, desktop applications and prototypes.
Three benefits to incorporating Card Sorting into your user experience study are:
- Ensures you have a coherent information architecture that matches the mental models and expectations of your users and customers.
- Optimizes the accessibility and ease of discovery of your menus and navigation paths.
- Explores whether the names of categories and products are understandable and match your user and customer expectations.
How Do I Create a Card Sorting Activity in my User Experience Study?
To create a Card Sorting activity within your user experience study, go to your Userlytics dashboard and either click an existing study to add the activity, or select the “Create New Study” optionTo create a Tree Testing task within your user experience test, go to your Userlytics dashboard. Click on “Create New Test” if you are building out a new test.


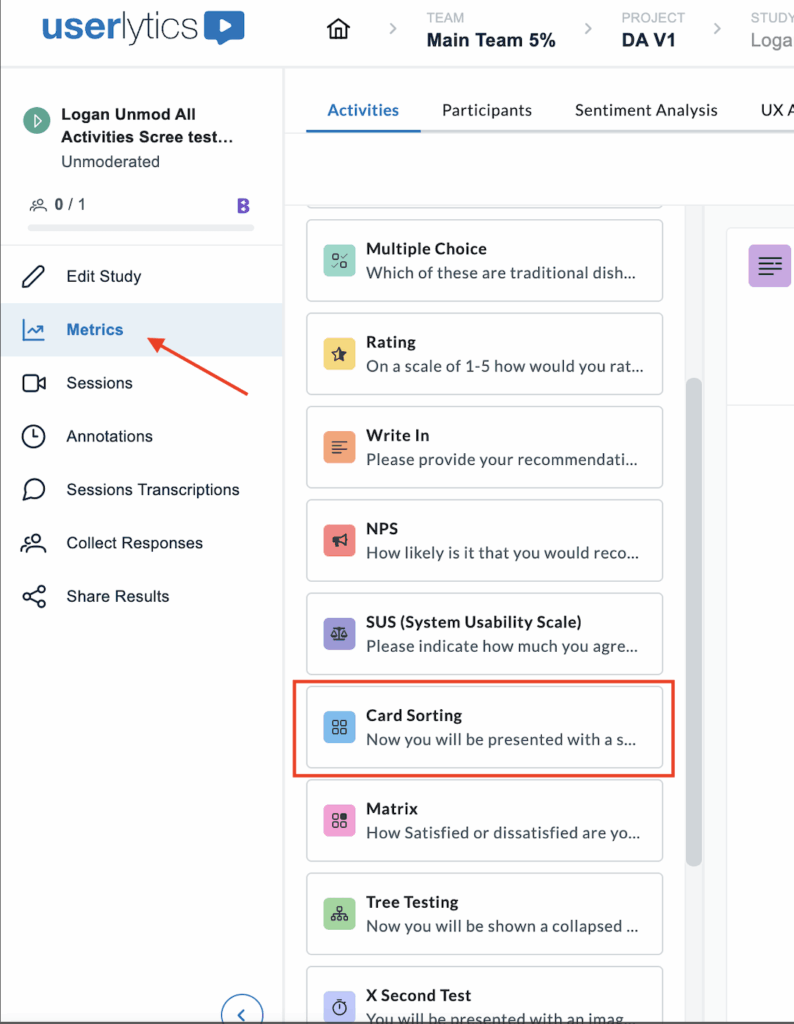
Once you have entered the study builder, click “Card Sorting” on the left-hand side of the screen where the study activities and questions appear.
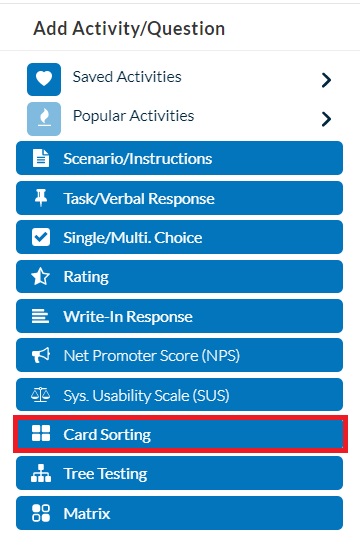
After selecting “Card Sorting” from the activity choices, click on the activity from within the various activities and questions on your UX study to begin building it out.
When building out your Card Sorting activity, first, you will have to customize the text your participants will see.
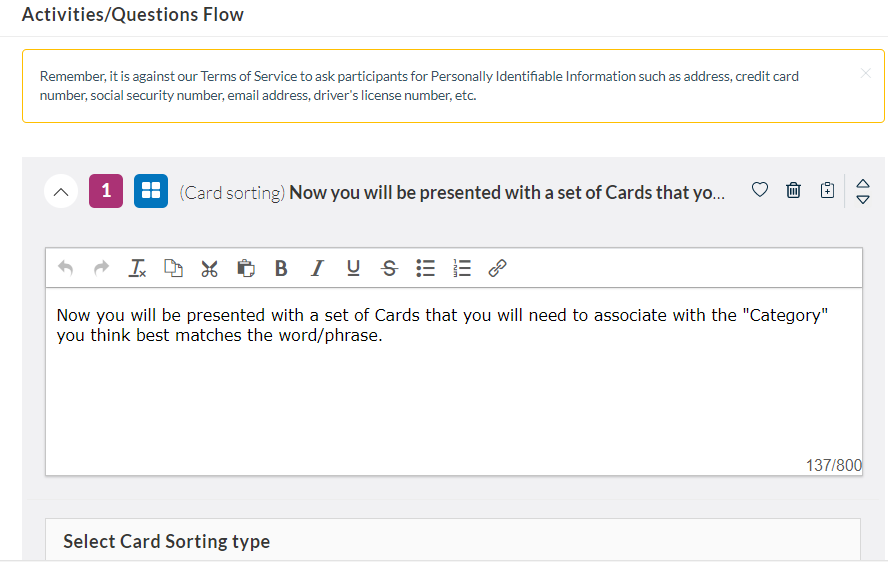
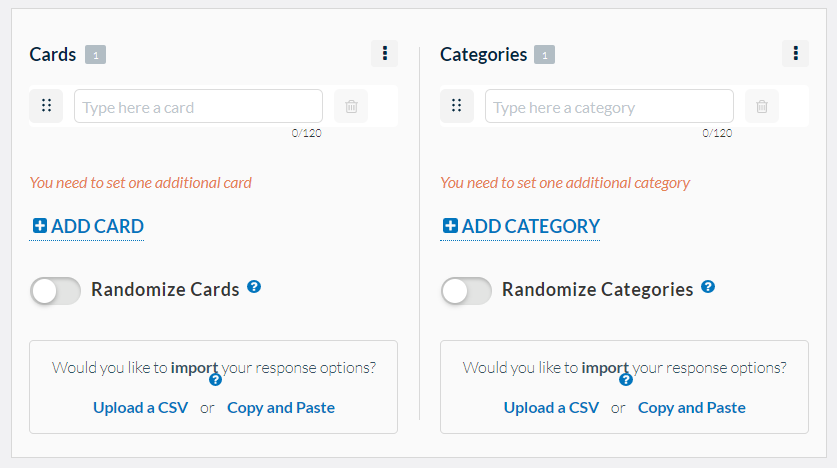
Then, you will have to design the sort type for the Categories your participants will be selecting from. You have the option of choosing from the following three options: “Open,” “Closed,” or “Hybrid.”
- Open: Participants create and name their own categories.
- Closed: You predetermine the categories participants will choose from.
- Hybrid: Predetermine some categories, and participants can also create their own.
If you choose the “Open” Card Sorting method, you will designate the Card names, and allow participants to create their own Category Names. If you select either the Closed or Hybrid sort options, you will designate names to both the Cards and the Categories.
How Do I Interpret Metrics from my Card Sorting Activity?
After your participants have completed your user experience study, you can go into your dashboard and view and interpret the results of their Card Sorting activity. First, find the “Metrics” option on your Userlytics dashboard under the study you are trying to analyze.
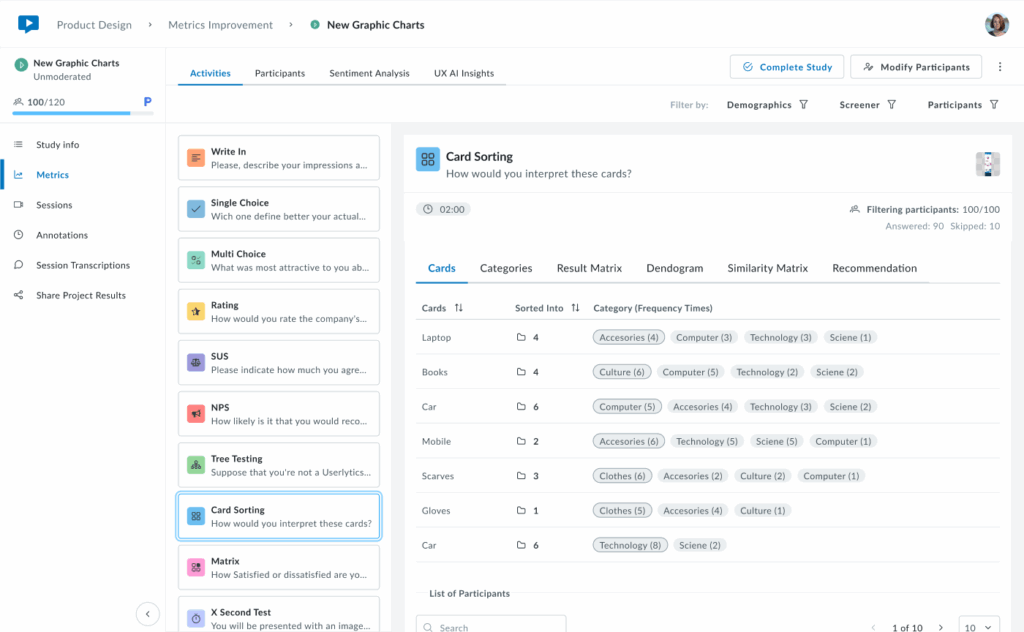
The first tab of results is the Cards tab, which provides an overview of how participants categorized each card in your study. You’ll see a sortable table that displays all cards and the different categories participants used and how often.
- Cards
Cards sorted into fewer categories with high agreement indicate clear, intuitive groupings. Cards sorted into many different categories suggest confusion or ambiguity in labeling, signaling opportunities to refine your content structure.
Below the cards overview, access each participant’s complete sorting choices, time spent, and video recording to understand their reasoning and decision-making process.
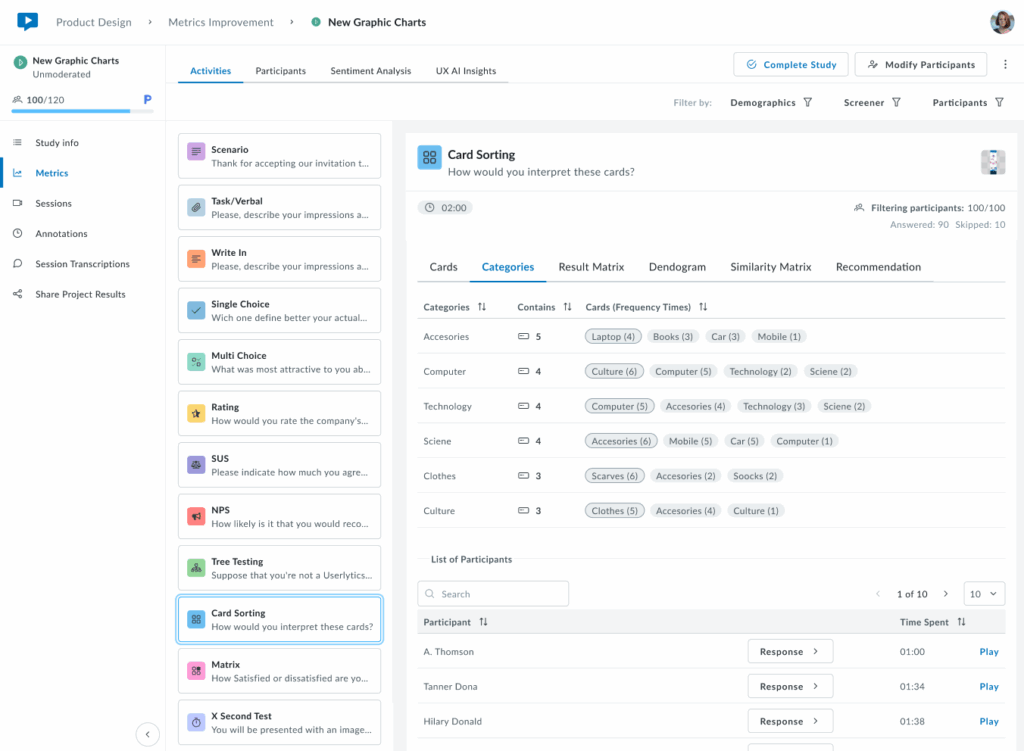
2. Categories
The Categories tab shows which cards were placed in each category. Categories can be created by participants, predefined by researchers in the Study Builder, or a combination of both.
Each category row displays the total number of cards it contains and lists all cards sorted into that category with their frequency counts (e.g., “4 (15)” means card “4” was placed in this category by 15 participants). Below, view individual participant responses and completion times to explore how each person organized the cards.
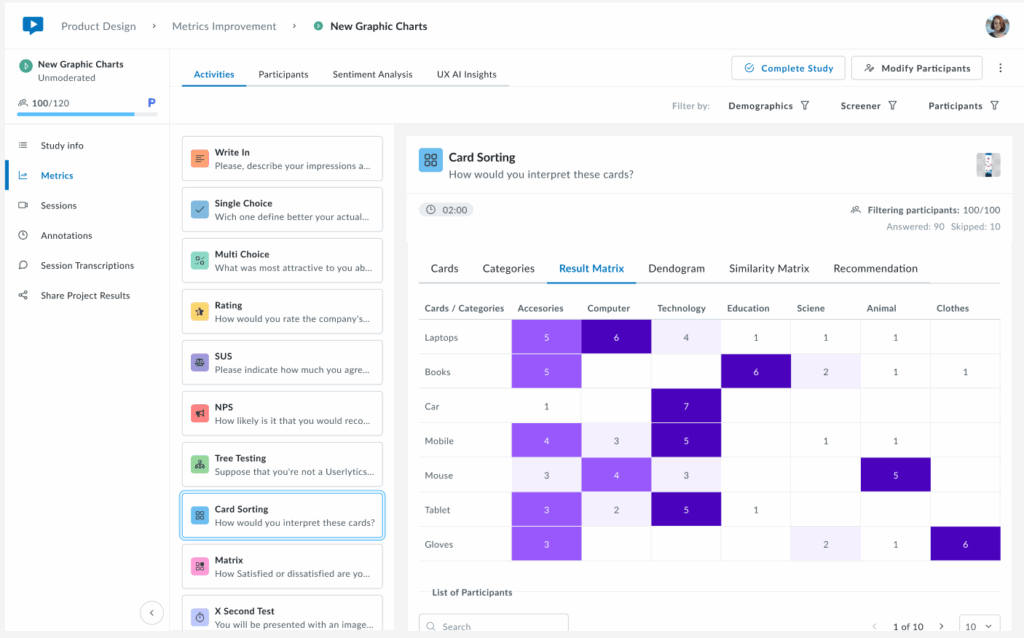
3. Result Matrix
The Result Matrix displays a color-coded heatmap showing how many participants sorted each card into each category. Rows represent cards, columns represent categories, and the intensity of the purple color indicates frequency:
- Dark purple – First option with the most responses (highest agreement)
- Medium purple – Second option with more answers (moderate agreement)
- Light purple – Third option with fewer answers (lower agreement)
The numbers inside each cell show exactly how many participants placed that specific card in that category. This visualization quickly reveals strong patterns of agreement (dark cells with high numbers) and areas of confusion (cards spread across multiple categories with low numbers).
4. Dendrogram
A brand new visualization that shows a hierarchical tree visualization that reveals how cards cluster together based on participant sorting patterns. Cards that were frequently grouped together appear closer in the tree structure, with branches showing the strength of their relationships.
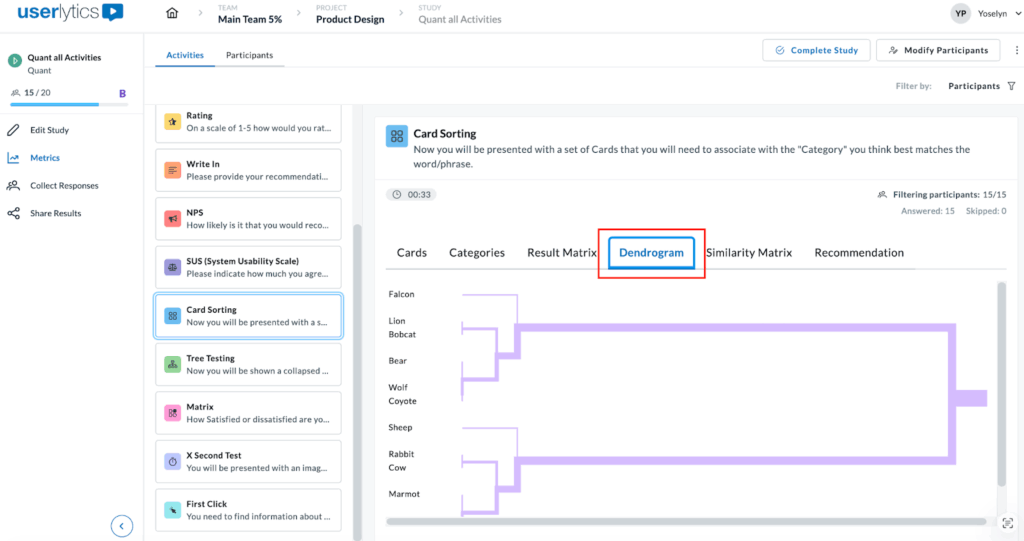
This powerful visualization helps you identify natural groupings and understand which cards participants consistently associate with one another. The horizontal distance between branches indicates how strongly related the cards are, while the shorter distances mean stronger associations. Use this view to discover logical category structures that align with user mental models.
5. Similarity Matrix
The Similarity Matrix is a color-coded grid that shows how frequently participants grouped pairs of cards together.
Each cell displays the percentage of participants who sorted both cards into the same category. Darker purple cells indicate stronger agreement, meaning most participants grouped those cards together, while lighter cells show weaker associations.
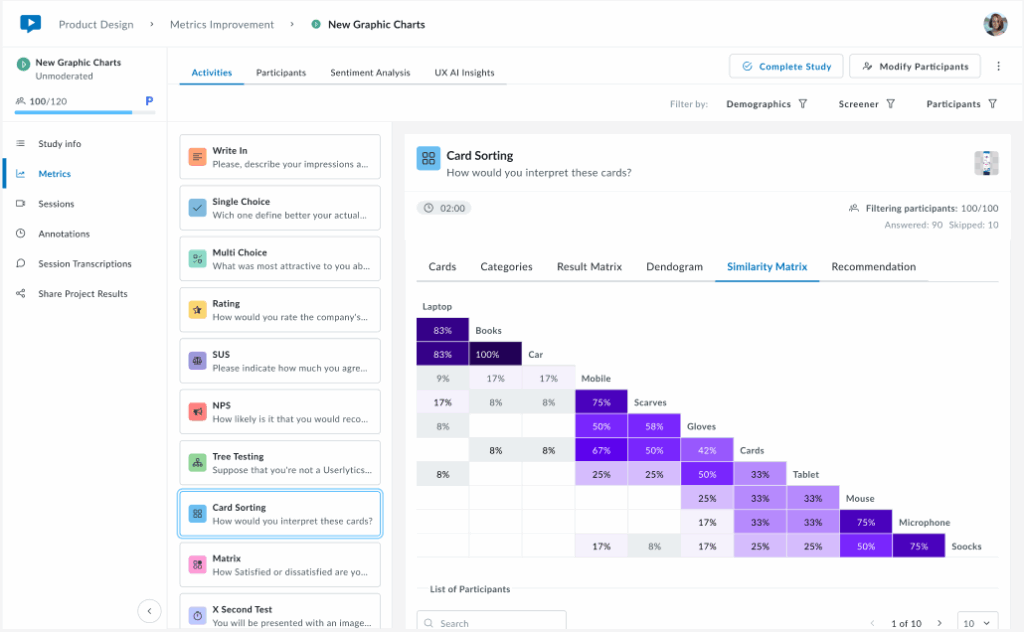
This matrix helps you identify which cards have strong natural relationships in users’ minds (high percentages) and which cards don’t clearly belong together (low percentages). Use this data to validate potential category groupings and spot cards that consistently cluster together across participants.
6. Recommendation
The Recommendation tab provides smart, data-driven category suggestions based on participant sorting patterns. Cards are automatically tagged as Recommended (green indicators) when there’s strong agreement among participants about their category placement.
At the top, you’ll see a summary showing the total number of cards and categories, along with a count of recommended cards. Use the “Show empty categories” toggle to view or hide categories with no card assignments. This intelligent analysis helps you quickly identify which category structures have strong user consensus, making it easier to finalize your information architecture with confidence.
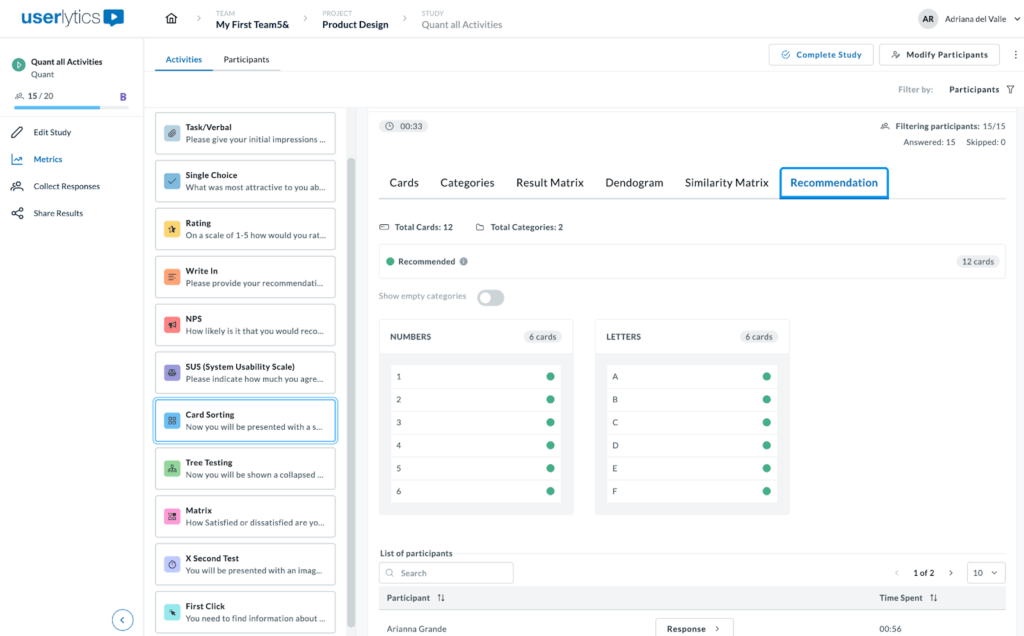
When you hover over icons or indicators in the Recommendation tab, small black tooltips appear to explain their meaning.
For example, hovering over the Recommended tag displays the message “Based on users’ feedback, these are the cards we suggest including in this category.”
This indicates that there is strong participant agreement on where each card belongs. Another tooltip appears near the category toggle, stating “All categories are displayed,” confirming that all available categories are currently visible.
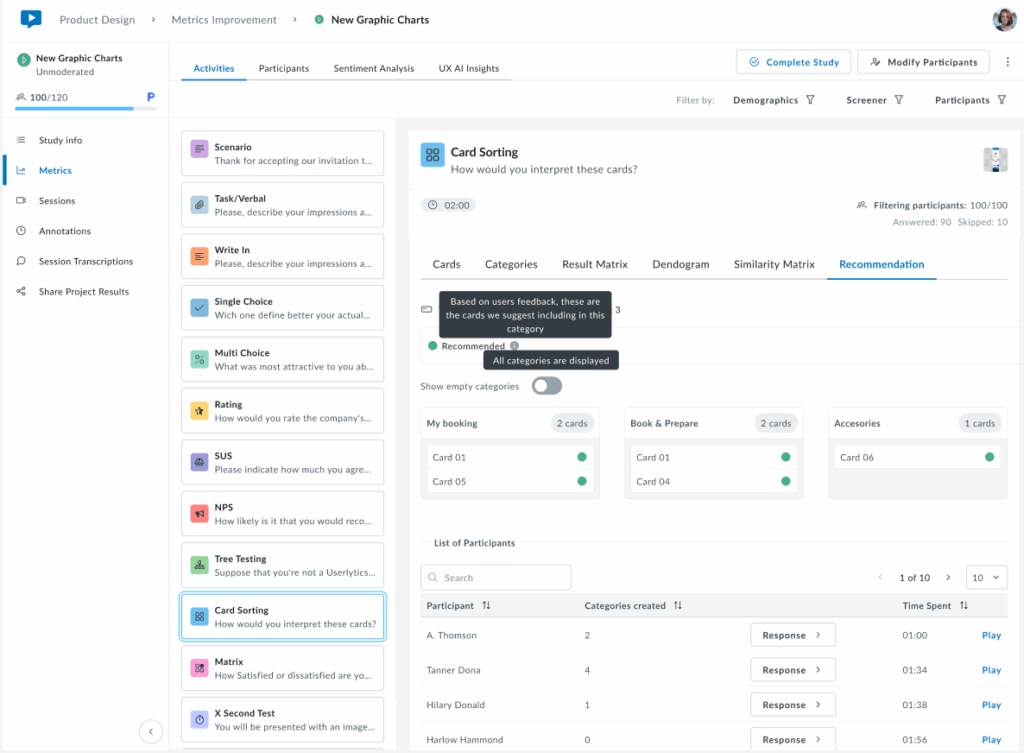
The following view shows the Recommendation tab in a more typical scenario where cards have mixed classification statuses. The system automatically tags each card based on participant sorting behavior. Cards marked with a yellow indicator are tagged as Needs Review, suggesting that user responses were inconsistent or unclear. When hovering over the yellow tag, a tooltip appears that reads: “User responses suggest that these cards are unclear. It may be worth considering a different category or renaming the card.” This helps users understand why certain cards may require attention or adjustments.
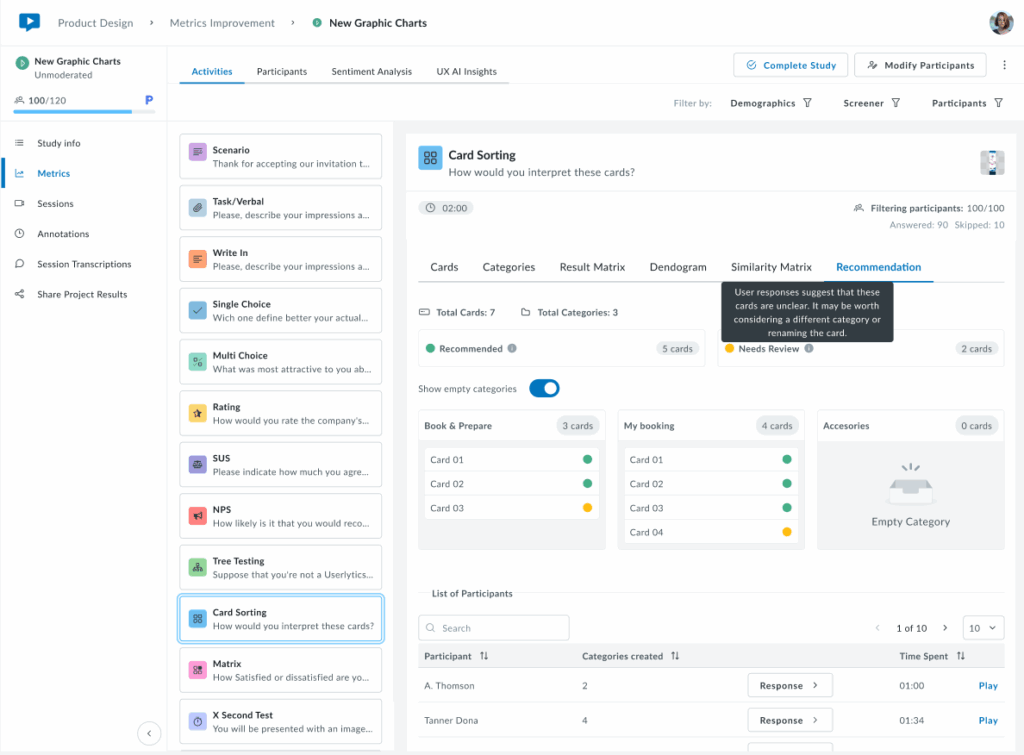
At the top, a summary shows the total number of cards and categories, along with a count of cards under each status. The Show empty categories toggle is on, so even empty categories (like “Accessories”) are displayed. This provides a complete overview of all possible categories, helping users see both assigned and unassigned cards in one place.
The following view shows the Recommendation tab with all three card statuses: Recommended (green), Needs Review (yellow), and Uncategorized (red). These tags indicate how consistently participants sorted each card.
Hovering over each label displays a tooltip explaining its meaning. For example, the Uncategorized tooltip says the system couldn’t place those cards into any category due to low participant agreement.
At the top, you’ll see the total number of cards and categories, along with counts for each status. Through the Show empty categories toggle you can see all categories being displayed, including the empty ones.
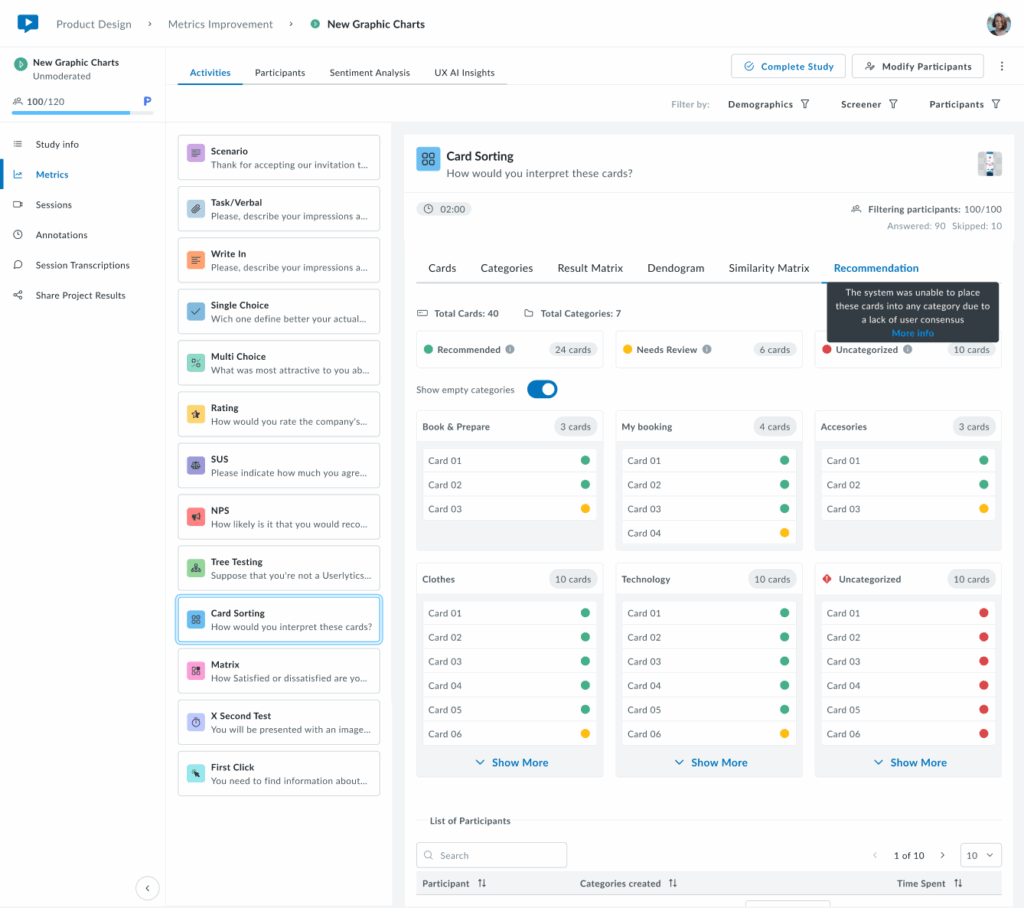
Only 6 cards are shown per category. If you want to see all cards per category, click on the “Show More” button and all cards corresponding to a category will appear.
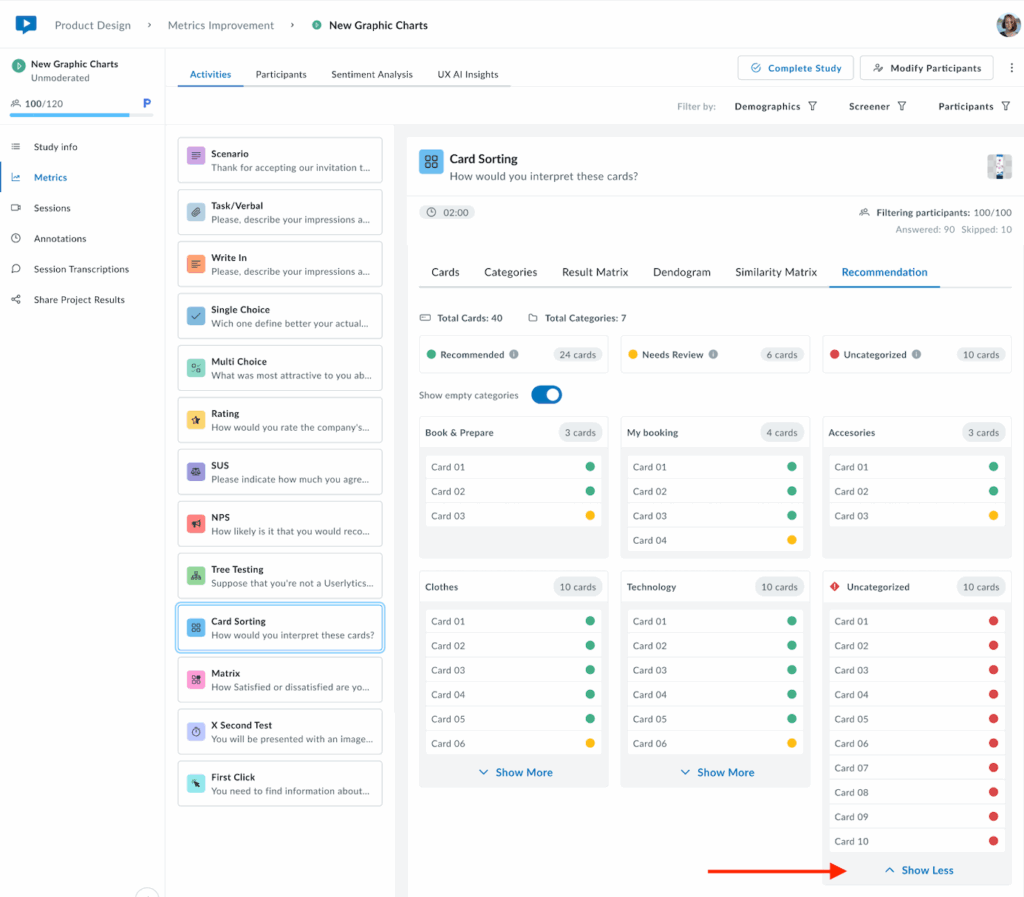
Lastly, this view shows the Recommendation tab when all cards are classified as Uncategorized (red). This means the system was unable to assign any cards to a category due to low participant agreement. The tooltip explains: “The system was unable to place these cards into any category due to a lack of user consensus.”

This scenario typically indicates that participants sorted the cards
