Sentiment analysis helps us understand the feelings behind words in texts. It’s used in many areas like customer service, UX research, and social media monitoring.
This article will show you the basics of sentiment analysis and how to use it on the Userlytics platform.
What is Sentiment Analysis?
Sentiment analysis uses natural language processing (NLP) and computational linguistics to find and extract feelings from text. It shows whether the text is positive, negative, or neutral.
This method is vital for businesses and UX researchers to understand customer opinions and feedback clearly.
Using Sentiment Analysis on the Userlytics platform
Generating Transcriptions
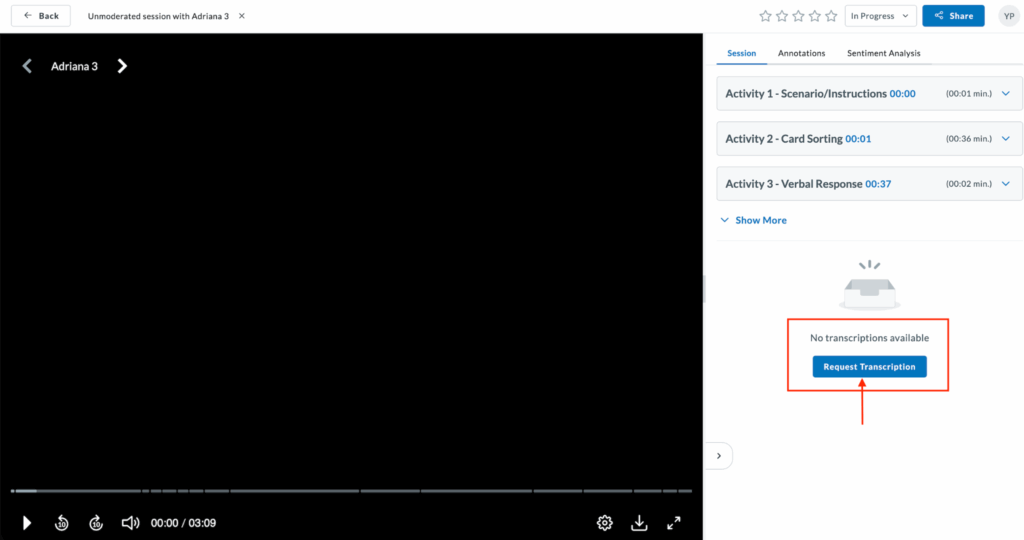
The first step in order to perform Sentiment Analysis is to generate transcriptions of your study session. Here’s a step-by-step guide on how you can do that:
- Select the Study: On your Userlytics dashboard, choose the study for which you want to generate a transcription.
- Click Session Option: On the left panel menu, click on the session option to view all session videos for the study.

- Select Session: Select the session you wish to transcribe from the list.

- Request Transcription: Click the “Request Transcription” button. You can choose to be notified by email when the transcription is complete.

- Receive Email Notification: Once the transcription is ready, you will receive an email notification.
- Access Transcription: Return to the transcription section and find the new button next to the session for which you requested the transcript. You can also access it through the left hand menu under “Sessions Transcriptions.”

- Browse and Search: Browse through the transcribed text, search for specific terms, and jump to specific moments. Create annotations if needed.
Utilizing Transcriptions for Sentiment Analysis
Now that your study has been transcribed, you can perform Sentiment Analysis.
Requesting Analysis:
You can request sentiment analysis via the Metrics section. To do so, click on the “Metrics” section, pick a participant and click “Request Sentiment Analysis” to begin.

A prompt will appear with the following options:
- Email notification toggle – Enable to receive an email when the analysis is complete
- Remaining transcriptions counter – Shows how many transcription credits you have available (e.g., “15/40”)
- Plan limitation notice – If you’re running low on transcriptions, you’ll see “Your plan is limited. Do you need more transcriptions?” with a link to Contact Sales to increase the limit.
Click Start to begin processing, or Cancel to return without generating the analysis.

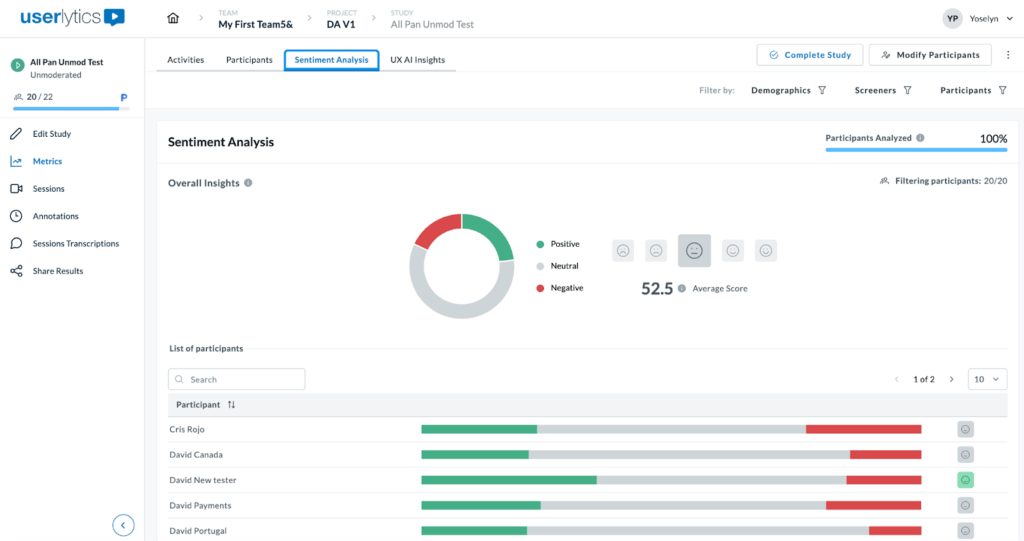
Once generated, view aggregated insights across all participants with overall insights, including:
Participants Analyzed – Percentage with completed analysis
Donut chart – Sentiment distribution (green = positive, gray = neutral, red = negative)
Average Score – Overall sentiment with indicators

Each participant row displays a horizontal bar with color-coded segments showing their positive (green), neutral (gray), and negative (red) sentiment proportions, plus an overall emoji indicator. Click any participant for a detailed breakdown.
Use the top-right filters to analyze sentiment by Demographics, Screeners, or specific Participants.
If you would like to know more about Sentiment Analysis, and other capabilities at your disposal on the Userlytics platform, visit our Help Section.
FAQ
1. What is sentiment analysis?
Sentiment analysis is a method to find the emotional tone of text, labeling it as positive, negative, or neutral. It helps understand what customers think and feel.
2. What are the benefits of using sentiment analysis on Userlytics?
Sentiment analysis on Userlytics helps you quickly understand user emotions and opinions. This insight can improve your customer service, enhance your users’ experience, and help you make smart design decisions.
3. How accurate is the sentiment analysis on Userlytics?
The accuracy of sentiment analysis on Userlytics is high, thanks to advanced NLP techniques and continuous algorithm improvements. However, it is important to review and validate the results, especially for complex or nuanced feedback.
4. Can sentiment analysis handle different languages on Userlytics?
Yes, the Userlytics platform supports sentiment analysis in multiple languages. It uses language-specific algorithms to ensure accurate sentiment classification for user feedback in various languages.
